
Access valuable RNA-seq insight in hours instead of days for 18 different species using proven published algorithms
Want to take the stress out of data analysis and fast-track your path to gene expression insights? With our new RNA-seq Analysis Portal, go from FASTQ files to pathway analysis insights in hours instead of days, integrating your data with qPCR and dPCR verification.
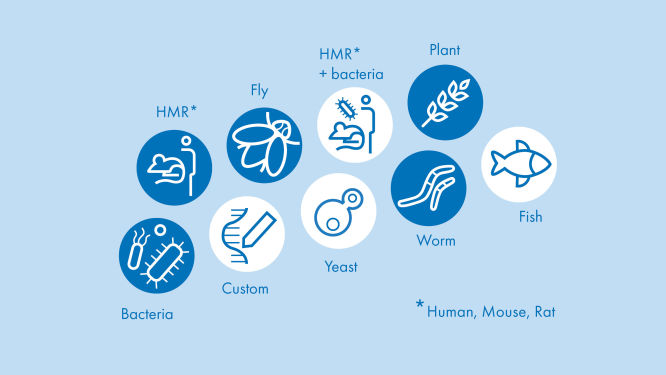
Easy. Fast. Online. Our portal supports the analyses for 18 different species using proven published algorithms. The RNA-seq Analysis Portal is compatible with QIAseq and other major RNA library kits. Perform your analyses anytime, anywhere.The RNA-seq Analysis Portal is compatible with the most commonly used RNA library preparation Kits.
Illumina TruSeq Stranded Total RNA Library Prep (Human/Rat, Gold, Globin) AND Stranded Total RNA Prep with Ribo-Zero Plus
New England Biolabs NEBNext Ultra II Directional RNA Library Prep Kit for Illumina Roche Sequencing solutions
QIAGEN QIAseq miRNA Library Kit, QIAseq UPX 3’ Transcriptome Panel, QIAseq UPXome RNA Library Kit, QIAseq Stranded RNA Kits, QIAseq FastSelect Kits
KAPA / Roche RNA HyperPrep Kit
Takara Bio SMARTer Stranded Total RNA Sample Prep Kit – HI Mammalian AND SMARTer Stranded Total RNA Sample Prep Kit – Low Input Mammalian
Thermo Fisher Scientific Collibri Stranded RNA Library Prep Kit for Illumina Systems
"The RNA-seq Analysis Portal displays all the necessary information on a single screen in an easy-to-understand manner, making it easy to analyze and draw the plots and create figures which can be used for publication."
Dr. Noriaki Sasai, Developmental Biomedical Science, Division of Biological Science, Nara Institute of Science and Technology, Ikoma, Japan
From Illumina, the TruSeq Stranded Total RNA Library Prep (Human/Rat, Gold, Globin) AND the Stranded Total RNA Prep with Ribo-Zero Plus.
From New England Biolabs, the NEBNext UltraTM II Directional RNA Library Prep Kit for Illumina Roche Sequencing solutions.
From KAPA / Roche, the KAPA RNA HyperPrep Kit.
From Takara Bio, the SMARTer Stranded Total RNA Sample Prep Kit - HI Mammalian AND the SMARTer Stranded Total RNA Sample Prep Kit - Low Input Mammalian.
From Thermo Fisher Scientific, the Collibri Stranded RNA Library Prep Kit for Illumina Systems.
Human (Homo sapiens), Mouse (Mus musculus), Rat (Rattus norvegicus)
Cow (Bos taurus), Dog (Canis lupus familiaris), Horse (Equus caballus), Crab-Eating Macaque (Macaca fascicularis), Rhesus Macaque (Macaca mulatta), Rabbit (Oryctolagus cuniculus), Pig (Sus scrofa)
Fruit Fly (Drosophila melanogaster), Roundworm (Caenorhabditis elegans), Zebrafish (Danio rerio), Thale Cress (Arabidopsis thaliana), Baker's / Brewer's / Budding Yeast (Saccharomyces cerevisiae), Fission Yeast (Schizosaccharomyces pombe)
Chicken (Gallus gallus), Rainbow Trout (Oncorhynchus mykiss)
The general steps performed by primary RNA sequencing analysis pipelines include, but are not limited to:
However, with the RNA-seq Analysis Portal and its fixed but optimized RNA sequencing analysis pipeline, you don’t have to worry about these details. The application does it all for you. As such, biological researchers like yourself can focus on the critical parameters of secondary differential gene expression analysis.
After completing primary RNA sequencing analysis to obtain raw gene expression values for each sample, secondary differential gene expression analysis then:
As easy as these calculations are to perform, the RNA-seq Analysis Portal automatically performs all them for you, once you set up your RNA sequencing-based differential gene expression analysis by defining the samples and groups to be compared. From there, the fold-change and p-values and other intermediate values are used for RNA-seq data visualizations such as a volcano plot and a heatmap, again automatically generated by the RNA-seq Analysis Portal for you.
Once determined, a list of statistically significant differentially expressed genes is interpreted by comparing with known pathway and disease gene lists and by identifying upstream regulators.
The list of statistically significant differentially expressed genes are compared with genes known to be involved with specific pathways or associated with specific diseases. Such a comparison helps biological researchers like yourself gain a deeper understanding of biology behind, or driven by, the differential gene expression observed in the experiment. Pathway comparisons can also even help you gain a deeper understanding of how the differentially expressed gene are regulated.
The number of differentially expressed genes, the number of genes associated with the pathway or disease, and the number of overlapping genes all define the statistical significance and the relevance of that overlap. The result of such enrichments are then typically sorted by decreasing statistical significance to bring the most relevant ones to the top.
Collecting all the genes for all the possibly relevant pathways and diseases can be extremely time consuming, and not all of this information is publicly available. The statistical significance calculations can also be rather complicated.
However, the RNA-seq Analysis Portal automatically compares your list of differentially expressed genes with comprehensive gene lists in a knowledge base containing a comprehensive list of pathways and diseases. The RNA-seq Analysis Portal also automatically calculates the statistical significance of those overlaps and returns a list of the top ten most relevant pathways and the top ten most relevant diseases, Finally, it even reports the top ten most relevant predicted upstream regulators including miRNA.
Normalization should be performed in a way that best controls for variability in the experimental protocol from the RNA isolation step through the sequencing runs.
A normalization factor or value is calculated for each sample that should be roughly uniform across the analyzed samples’ datasets. The raw expression values are then divided by the sample-specific normalization factor before continuing with averaging the normalized data and calculating fold change values and p-values.
Various normalization methods exist, and normally you would try a few and choose one that seems to work the best for your dataset. However, with the RNA-seq Analysis Portal and its published and well-established normalization method, you don’t have to worry about these details. It already uses a published and widely-accepted normalization method.
Any good experimental setup must include replicate treated or affected experimental samples and replicate untreated or unaffected control samples for comparison.
A critical factor is setting up any differential gene expression analysis is to define the groups for comparison. Any good experimental setup includes not only a set of treated or affected experimental samples or test samples, but also a set of untreated or unaffected control samples to which all experimental samples or test samples are compared.
Datasets obtained from samples using the same biological condition are therefore grouped and their normalized data across each individual gene averaged before calculating fold-change values during the secondary differential gene expression analysis. Experimental and/or biological replicates for every condition are also crucial for determining the statistical significance of those differential gene expression analysis results by calculating p-values.
Once these group definitions have been made in the RNA-seq Analysis Portal, the application takes care of the rest of the differential gene expression analysis for you.
Fold change vales are the ratios of the average normalized expression values between experimental and control groups for each gene in the dataset.
Fold change values greater than one indicate up-regulation in experimental groups relative to control groups. Fold change values less than one indicate down-regulation in experimental groups relative to control groups.
As easy as these calculations are to perform, the RNA-seq Analysis Portal automatically calculates them for you, once you set up your RNA sequencing based differential gene expression analysis by defining the samples and groups to be compared.
The p-values represent the likelihood of obtaining the observed results if no real difference existed, and various methods are available to calculate p-values.
The lower the p-value, the greater the statistical significance of the associated fold change values. The higher the p-value, the smaller the statistical significance of the associated fold change values. More extreme fold change values tend to have smaller p-values. More samples can improve p-values, especially for smaller changes in expression or smaller fold change values.
Calculating p-values is a bit complicated, and there are a number of methods to correct them for false discoveries. However, the RNA-seq Analysis Portal automatically calculates them for you and corrects for false discoveries, once you set up your RNA sequencing-based differential gene expression analysis by defining the samples and groups to be compared.
Species | Common Name | RNA Analysis | RNA Biological Insights | miRNA Analysis | miRNA Biological Insights |
---|---|---|---|---|---|
Arabidopsis thaliana | thale cress | ||||
Bos taurus | cow | ||||
Caenorhabditis elegans | roundworm | ||||
Canis lupus familiaris | dog (laborador retriever breed) | ||||
Danio rerio | zebra fish | ||||
Drosophila melanogaster | fruit fly | ||||
Equus caballus | horse | ||||
Gallus gallus | chicken | ||||
Homo sapiens | human | ||||
Macaca fascicularis | crab-eating macaque | ||||
Macaca mulatta | rhesus macaque | ||||
Mus musculus | mouse | ||||
Oncorhynchus mykiss | rainbow trout | ||||
Oryctolagus cuniculus | rabbit | ||||
Rattus norvegicus | rat | ||||
Saccharomyces cerevisiae | baker's yeast, brewer's yeast, budding yeast | ||||
Schizosaccharomyces pombe | fission yeast | ||||
Sus scrofa | pig |
Species | Common Name | RNA Analysis | RNA Biological Insights | miRNA Analysis | miRNA Biological Insights |
---|---|---|---|---|---|
Arabidopsis thaliana | thale cress | done | done | ||
Bos taurus | cow | done | done | done | |
Caenorhabditis elegans | roundworm | done | done | ||
Canis lupus familiaris | dog (laborador retriever breed) | done | done | ||
Danio rerio | zebra fish | done | done | done | |
Drosophila melanogaster | fruit fly | done | done | done | |
Equus caballus | horse | done | done | ||
Gallus gallus | chicken | done | done | done | |
Homo sapiens | human | done | done | done | done |
Macaca fascicularis | crab-eating macaque | done | |||
Macaca mulatta | rhesus macaque | done | done | done | |
Mus musculus | mouse | done | done | done | done |
Oncorhynchus mykiss | rainbow trout | done | |||
Oryctolagus cuniculus | rabbit | done | done | ||
Rattus norvegicus | rat | done | done | done | done |
Saccharomyces cerevisiae | baker's yeast, brewer's yeast, budding yeast | done | |||
Schizosaccharomyces pombe | fission yeast | done | |||
Sus scrofa | pig | done | done |
The RNA-seq Analysis Portal is an online RNA sequencing analysis software application designed for biological researchers with little or no bioinformatics experience or expertise. Its RNA sequencing analysis pipeline is fixed but optimized so you don’t have to worry about the primary RNA sequencing analysis details. The RNA-seq Analysis Portal also completes the secondary differential gene expression analysis calculations of fold-change values and p-values. The RNA-seq Analysis Portal also provides RNA-seq data visualizations such as a volcano plot and a heatmap, both commonly used to report differential gene expression analysis results in peer-reviewed publications. All you need to focus on is setting up the sample comparisons that you need to make.
With the RNA-seq Analysis Portal, you can analyze your raw RNA next generation sequencing data for your gene expression-based biomarker discovery – or any other project – with ease and confidence. It supports seven of the most frequently used RNA library preparation kits and 18 of the most commonly studied species model systems. Move immediately from your instrument’s FASTQ files to raw gene expression values. Fixed but optimized pipelines are available specific for the RNA library preparation kit that you used. Transcriptomes for each of the supported species are also available to automatically map reads to genes.
The RNA-seq Analysis Portal automatically takes the raw gene expression values and calculates fold change values and p-values using a published and well-established normalization method to correct for any experimental variation from nucleic acid isolation through the sequencing run. You are then free to use the fold change value and p-value filters as well as the automatically updated volcano plot and heatmap visualizations to find a subset of statistically significant differentially expressed genes. The application’s “What’s Next” feature allows you take that preliminary biomarker panel and further validate it using an alternative method such as real-time or digital RT-PCR experiments and a larger number of samples.
The volcano plot automatically generated by the RNA-seq Analysis Portal graphs for each gene the log2 of its fold change value on the x-axis versus the log10 of its p-value on the y-axis. A log2 fold change value on the x-axis of zero means no change in gene expression. Up-regulated genes return positive, while down-regulated genes return negative log2 fold change values on the x-axis. Larger numbers log10 p-value y-axis values indicate greater statistical significance. The most statistically significant differentially expressed genes of interest lie in the upper left and right sections of the volcano plot beyond researcher defined thresholds.
The heatmap automatically generated by the RNA-seq Analysis Portal is a non-supervised hierarchical clustering of selected normalized gene expression values across all samples. Genes are clustered along one axis, while samples or groups are clustered along the other axis. More intense color coding indicates lower or higher normalized expression values for each gene across the samples or groups compared. Samples should cluster into their defined experimental groups. Genes that have similar patterns of gene expression changes across the samples or groups then cluster together. Results may be used to build the classifiers that determine to which groups newly analyzed samples belong based on the expression of the genes selected and defined by the preliminary experimental analysis.
Setting thresholds for fold change value and p-value filters is crucial for interpreting any differential gene expression analysis. Transcriptome analyses can return thousands of differentially expressed genes. This number of targets is too many to be analyzed conveniently by real-time or digital RT-PCR. They may also be too many to analyze affordably with a focused or targeted RNA sequencing panel. Increasing fold change value and p-value threshold stringency decreases target numbers to only the most statistically significant and differentially expressed genes and those more likely to distinguish biological phenotypes. The RNA-seq Analysis Portal allows to easily and conveniently adjust fold change and p-value thresholds and immediately see the reduced number of gene targets in its table, volcano plot, and heatmap.
By combining all these features into one application, the RNA-seq Analysis Portal allows biological researchers like yourself to focus on the final differential gene expression analysis results. Simply ensure you have included appropriate control samples and multiple replicates for each of your biological conditions, including the controls. Then, move immediately to defining the sample or group comparisons you need to make.
Make the RNA-seq Analysis Portal an integral part of your RNA sequencing based differential gene expression analysis project today.